Profiling & Debugging
Live-profiling

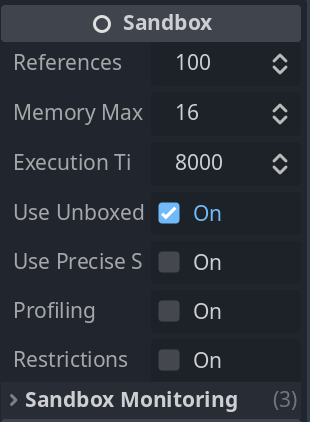
Each Sandbox instance has a profiling property which can be enabled. Once enabled, calls into the Sandbox will automatically generate profiling samples, which is collected in a central place. In other words, a kind of statistical sampling is performed automatically. This works on all platforms.
Visualizing hotspots
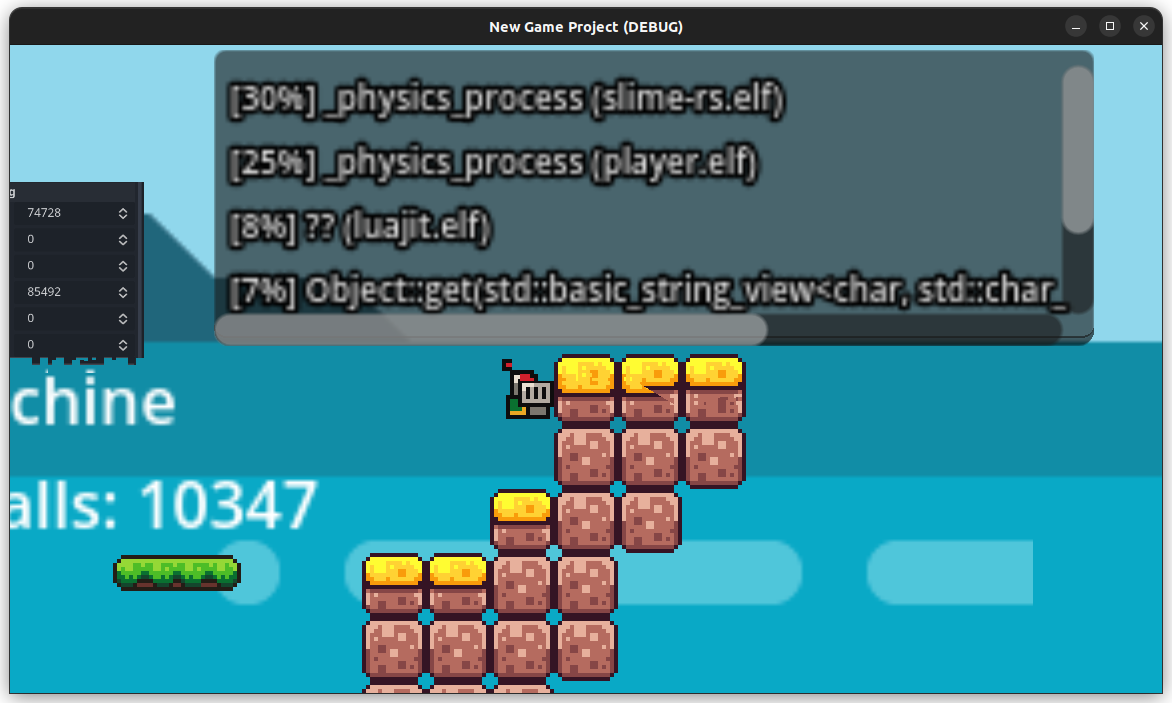
Using a GDScript timer timeout we can retrieve the profiling information using the static Sandbox.get_hotspots() function.

The image shows that the RustScript controlling the slimes is the most demanding Sandbox instance currently running, and the function is _physics_process. All samples have to add up to 100%, and in this example it was only using 15% CPU while debugging from the editor.
func _on_timeout() -> void:
	# Get an array of up to 6 hot spots
	var hotspots : Array = Sandbox.get_hotspots(6)
	# Stats are in the last element
	var stats : Dictionary = hotspots[-1]
	print(JSON.stringify(hotspots, "    "))

	var txt = get_node("../TextEdit") as TextEdit
	txt.text = ""
	for i in 4:
		var prof : Dictionary = hotspots[i]
		var percent = str((prof["samples"] * 100) / stats["samples_total"]) + "%"
		var path = String(prof["file"]).split("/")
		var elf = path[path.size()-1]
		txt.text += "[" + percent + "] " + prof["function"] + " (" + elf + ")\n"
The first argument is the number of hotspots to generate in the result. By default 6 items.
The second argument is a callable which only gets called once an instance has an unknown program loaded. The callable is a fallback method and usually not needed.
The return value is a Dictionary that you can print with:
print(JSON.stringify(hotspots, " "))
That will give you the elements, and you can easily use that to create your own visualization.
Pros & Cons
This method works on all platforms, including when running in a browser.
It can only record time spent in the Sandbox, excluding time spent handling Godot-specific functionality like manipulating nodes. Because of this, it is usually a good idea to also profile the game itself, and then use the live-profiling from the Sandboxes as supplemental information.
On the other hand, if you are performing heavy calculations in the Sandboxes then this live-profiling should accurately reflect that.
Debugging
It's possible to live-debug Sandbox instances, however it hasn't been implemented yet. Come back later.
Still, if you're having trouble with a program and unsure where it's crashing, try enabling Precise Simulation. Enabling it will make the emulator execute one instruction at a time, revealing exactly where the crash is. Also use print() and printf() liberally!
Exception guide
Exceptions can be mysterious, so here are some explanations:
-
Too many arena chunks: The program made too many heap allocations without freeing them. You can increase this maximum by setting a property on the Sandbox, however most likely there is a memory leak. Something is not getting freed. -
Execution space protection fault: The emulator jumped to a part of memory that doesn't contain executable code. Usually 0x0, which is NULL. The most common cause is trying to call a function in the Sandbox that doesn't exist. Theaddress_of()function returns 0x0 when a function is not found. If it's not that, it could also be a function pointer that is NULL and is getting called. -
Protection fault: The emulator tried to read or write from memory that is not readable/writable. If the address is 0x0 (or very close, eg. 0x38) then it is for sure an attempt to read or write to NULL. -
... is not known/scoped: An attempt to use a Variant that wasn't created by us. For sure an invalid Variant, or an outdated Variant from a previous function call. -
Failed to cast Variant to <type>: Trying to cast a Variant to a specific type, such asintorStringfailed, as that was not the Variants type. This often happens with mismatched function arguments or when a function returns NIL instead of the expected type when it fails.
Example:
	Variant v = 1;
	v.as_byte_array();
Gives us the error:
Failed to cast Variant to PackedByteArray for Variant of type 2 (Int) in function as_byte_array
It's saying that we tried to cast an Int variant to a PackedByteArray.